


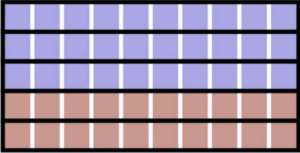
To draw five districts such that blue wins in most of them, draw horizontal lines separating each row of squares. In this case, blue wins three out of five of the districts:
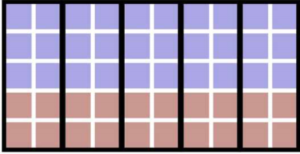
If we drew vertical lines to create districts with two columns each, then blue would win in all of them.
If we want red to win more districts, we can draw the lines like this:
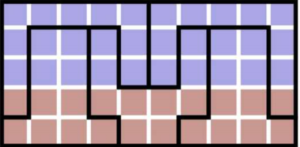
Now red wins three out of the five districts.
As we see, the outcome of the election might depend on how district lines are drawn and who is in charge of drawing them. Drawing district lines in a politically motivated way is called gerrymandering. States have the right to redraw their district lines and only have to adhere to some loose guidelines: each district must contain approximately the same number of people, have a reasonable shape, be connected, keep counties and cities in one district, and not split communities of interest. The districting must also respect the Voting Rights Act of 1965 which prohibits gerrymandering based on race. Political gerrymandering, however, is allowed. In most states the party in power redraws district lines to their own political advantage – the party chooses the voters rather than the other way around. For example, in 2012, Republicans won 61% of state seats in Wisconsin but won fewer than 50% of the votes. In 2018, Republicans won 77% of House seats in North Carolina but won only about 50% of the votes. Both major parties in the U.S. have used political gerrymandering to their benefit.
There have been a number of legal challenges to gerrymandering in the U.S. recently. For instance, in 2018, the Pennsylvania State Supreme Court decided that the state’s
districts were too gerrymandered and had to be redrawn. In 2019, the Supreme Court upheld Virginia court’s decision that the state had to be redistricted because of racial gerrymandering.
One potential solution to gerrymandering is the use of independent commissions for redistricting, so that no party has the power to draw the lines to their advantage. Mathematics such as efficiency gap calculations and compactness scores can also be used to help identify gerrymandered districts. Stay tuned for more on these soon!

Since the NPVIC would only be enacted if it guaranteed that the winner of the popular vote would win the election, the states in the compact need to have a cumulative minimum of 270 electoral votes. The states already in the coalition have 196 votes total, so if the next three states with the largest number of votes that are not already in the coalition join (Texas – 38, Florida – 29, Pennsylvania – 20) the coalition would reach the 270 benchmark. Therefore, at a minimum, three more states must join the NPVIC for it to go into effect. Bills advocating entry into the NPVIC have been introduced in six other states: Missouri, Ohio, Pennsylvania, South Carolina, Texas, and Virginia. Depending on which states choose to pass this legislation, the NPVIC could soon have enough electoral votes to impact the next presidential election.
There are some legal concerns if the NPVIC were to ever actually be enacted. One of them is a question of whether states even have the power to change the way they assign their electoral votes without going through Congress. Whatever the challenges, the goal of the NPVIC is to make election results align more to the will of the people.
Another way to fix the U.S. presidential elections would be to abolish the Electoral College altogether and use the popular vote. This would take a constitutional amendment requiring the support of ⅔ of the Congress and ¾ of the states. Another option is to add electoral votes so that every elector represents the same number of votes, meaning that all votes have the same weight. Based on Wyoming, the state with the smallest population, about 1,700 new electors would need to be added.

The original division has 32 blue voters and 32 red voters in 4 competitive voting districts. Thus, in an election, there would be a tie, which correctly reflects the preferences of the people.
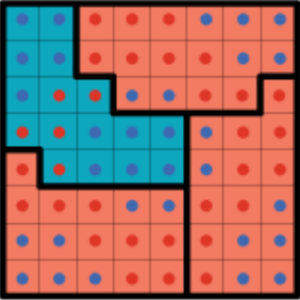
However, if blue had the power to redraw district lines, they might do something like this:
Red voters are primarily packed into one district to minimize their impact, since the three other districts are primarily blue. The residual red voters are cracked so their votes hold little weight in those three districts. The blue candidate thus wins the election 3-1.
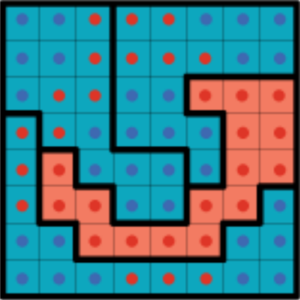
If the red party were to draw the district lines, they could do it like this:
Most blue voters are cracked into the three red districts where they are outvoted. The rest are packed into the remaining district. With this configuration, the red candidate now wins the election 3-1.
There are several other tactics that are used to gerrymander districts: Stacking creates a false perception of equity by placing a group of low-income, less educated (usually minority) voters in the same district as high-income, better-educated white voters who turn out to vote in greater numbers. Hijacking occurs when districts are changed in a way that two incumbents now live in the same district and are forced to run against each other, ensuring that one of them will be eliminated. Kidnapping happens when district lines are moved to place an incumbent’s home address into another district where reelection might be more difficult.
Packing and cracking can produce lots of wasted votes, or votes that do not make a difference in an election: in a cracked district, votes for the candidate without a chance of winning are wasted. Similarly, in a packed district, excess votes above the 50% majority threshold for the winning candidate are also wasted. Stay tuned to learn how these wasted votes can be used to calculate the extent of gerrymandering in a district.
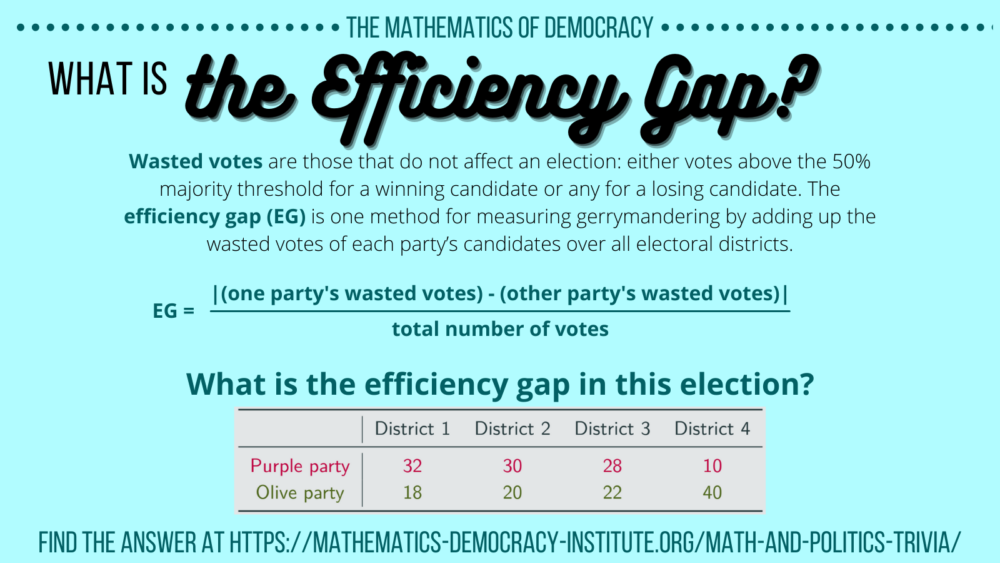
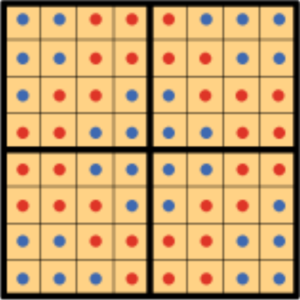
In this example, Purple party is the overall winner, having won three out of four districts. To calculate the efficiency gap, let’s start by finding each party’s wasted votes. Since there are 50 voters per district, 26 votes are needed in each district to win.
Purple party:
- District 1: Extra 6 votes are wasted above the required 26
- District 1: Extra 4 votes are wasted above the required 26
- District 3: Extra 2 votes are wasted above the required 26
- District 4: All 10 votes are wasted since Purple lost that district
Total Purple party wasted votes: 6 + 4 + 2 + 10 = 22.
Olive party:
- District 1: All 18 votes are wasted since Olive lost that district
- District 1: All 20 votes are wasted since Olive lost that district
- District 3: All 22 votes are wasted since Olive lost that district
- District 4: Extra 14 votes are wasted above the required 26
Total Olive party wasted votes: 18 + 20 + 22 + 14 = 74.
So the efficiency gap (EG) is:

in favor of the Purple Party. The efficiency gap method to measure gerrymandering was devised by Stephanopoulos and McGhee in 2014. According to them, an efficiency gap of over 7% is problematic and indicative of gerrymandering.
This method is widely used in gerrymandering court cases. For instance, here is an example from Maryland in 2016:
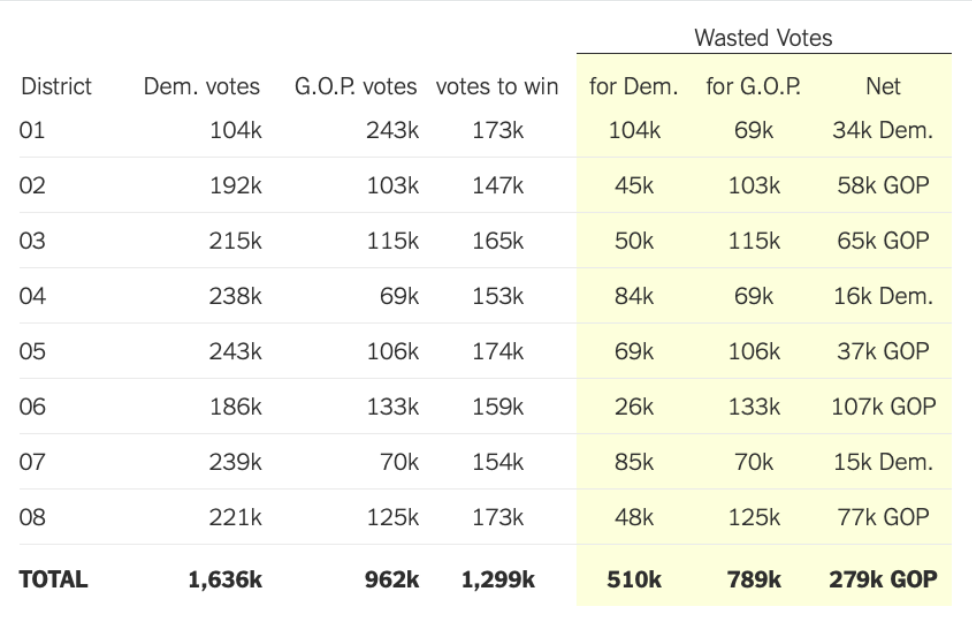
510,000 Democratic votes and 789,000 Republican votes were wasted, so the net wasted votes are 279,000 Republican votes. This produces a 10.7% efficiency gap that favors the Democrats.
Using the efficiency gap to measure gerrymandering can be problematic since it ignores geography and demographics. Voting districts are intended to give a voice to voters with similar interests, so it makes sense that districts with distinct geographic or demographic characteristics may vote similarly, creating a large amount of wasted votes and, consequently, a large efficiency gap. Additionally, the efficiency gap ignores the fact that like-minded voters may naturally choose to pack themselves in districts: many urban areas produce a high efficiency gap due to the large amount of Democratic voters. An alternative to the efficiency gap is to use geometry to detect gerrymandering, a topic we will cover in future trivia posts.
To understand what shapes the Polsby-Popper Compactness Score misevaluates as gerrymandered, it is helpful to understand where the equation comes from. The idea is to compare the area of a shape with its perimeter, so we look at the ratio of Area/Perimeter. But notice that when a shape is dilated by a factor of k, its area increases by a factor of k^2. For example, a square that doubles its perimeter has four times as much area. To make the ratio invariant under scaling so we can compare scores of districts of all sizes, we modify it to Area/Perimeter^2. The Isoperimetric Inequality now says that Area/Perimeter^2 ≤ 1/4π for every shape. Noting that this ratio is always greater than zero and multiplying through by 4π, we finally get
0 ≤ 4pi Area/perimeter^2 ≤ 1.
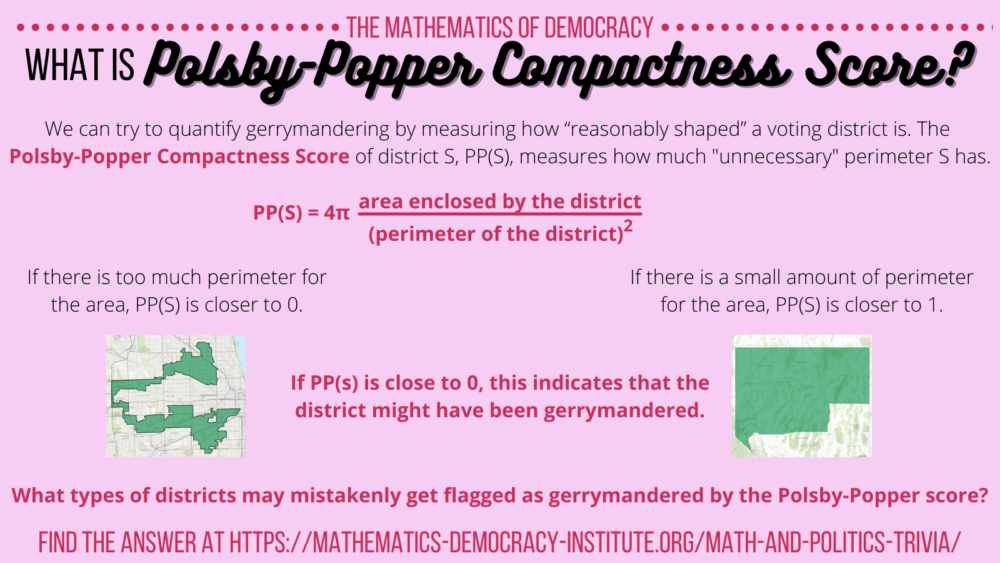
The middle is how PP(S) is defined, and the inequalities show that this number is always between 0 and 1. If there is too much perimeter for the shape, then the denominator of this fraction is bigger than the numerator, indicating that the district may be more gerrymandered with a Polsby-Popper score closer to 0,. In contrast, if there is a relatively small amount of perimeter compared to area, then the numerator and denominator are close in value, giving a score closer to 1. In fact, a circle is the only shape with the maximum score of 1. Another way to think about PP(S) for a district S is to imagine stretching the perimeter of S into a circle. If the resulting circle’s area is much bigger than the area of S, then the Polsby-Popper score is low.
To start, we recalculate the standard divisor s = total population/total number of seats = 14/11 = 1.27. Therefore we get:
There are several other compactness score that use geometry to measure gerrymandering:
- Schwartzberg score: Ratio of the perimeter of the region to the circumference of a circle whose area is equal to the area of the region.
- Reock score: Ratio of the area of the region to the area of smallest circle containing it.
- Convex hull measure: Ratio of the area of a region to the area of its convex hull, the smallest shape containing it in which any two points can be connected by a line segment that stays in the region.
- Length-width score: Ratio of the length to the width of the minimum bounding rectangle containing the region.
- X-symmetry: Flip a region across the horizontal line running through the middle of it. Take the ratio of the overlapping area of the two pictures and the area of the original region.
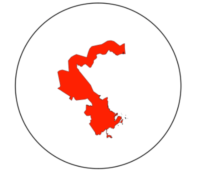
The Polsby-Popper Score is the most commonly used, but there is no agreement on how any of these scores should be interpreted. In fact, more than one are often used in court cases concerning gerrymandered districts. All of these scores have a number of flaws. For one, sometimes having a lot of perimeter is unavoidable or even intentional. As an example, this California district contains people who live along the coast, and they have similar demands in terms of tourism, urban planning, flood protection, etc.
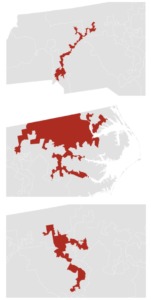
Similarly, this district in Chicago is populated by people of Hispanic origin.

The extra perimeter of these districts helps connect communities of interest, which is allowed and encouraged by law, yet they are given low compactness scores.
Groups of mathematicians have been working to find solutions to the problem of quantifying gerrymandering. One promising approach that uses graph theory, geometry and probability is due to the Metric Geometry and Gerrymandering Group from Tufts University.

After the 2020 census, most states have approved new Congressional district maps or are in the process of doing so. Organizations like FiveThirtyEight and the Princeton Gerrymandering Project are tracking these changes and how they will affect voters.
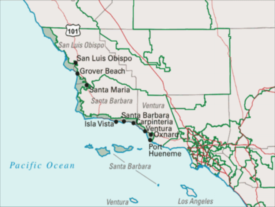
In recent years, North Carolina has been recognized as the state with the most gerrymandered districts. According to the Washington Post, the map used since 2012 had three of the most gerrymandered districts in the country.
In late 2021, North Carolina politicians approved a new congressional map that was overturned by the North Carolina Supreme Court for violating free and fair election guidelines in favor of the Republican party. North Carolina politicians are still in the process of negotiating a new map and must consider metrics of fairness. Though they have yet to approve a new district map ahead of the 2022 election cycle, the gerrymandering situation is unlikely to improve: without an independent commission, politicians are still free to draw the map that is beneficial to their own party.
It’s important to remember that members of both political parties engage in gerrymandering. Democratic Party-led Maryland is often considered the second most gerrymandered state: in the new congressional map passed in 2021, Maryland is accused of “cracking” conservative voters across all districts, preventing them from having the majority in any district. Two lawsuits have been filed against this map.
In 2021, Utah politicians voted on new district lines that divide, or “crack,” the predominantly liberal voters of Salt Lake City into all four districts. This map has an efficiency gap of 28.7 in favor of Republicans. Recall the efficiency gap is a metric that attempts to quantify gerrymandering by taking the difference of a party’s wasted votes over the total votes in any election. The originators of this metric suggested scores above 10 were indicative of gerrymandering.
Kentucky also approved a map that has been accused of unfairly favoring Republicans. In particular, the large 1st district packs liberal urban voters with more rural conservative populations who lean Republican, making it unlikely they will elect a liberal candidate. A lawsuit is underway in regards to this map.
Additionally, Texas has been accused of violating the Voting Rights Act with its new map that “cracks” black voters into multiple districts, preventing them from forming a voting block. They are currently in litigation with the State Department. Another indication of the potential gerrymandering in this map is the efficiency gap score of 15.
These are not the only states accused of gerrymandering, many of which are currently in legal proceedings over violating political gerrymandering standards. It is important to remember that quantifying gerrymandering is difficult, because sometimes oddly drawn districts are necessary to group like-minded voters or have naturally imposed borders because of geography. However, states with independent commissions that draw and approve district maps tend to have more free, fair, and competitive elections.
