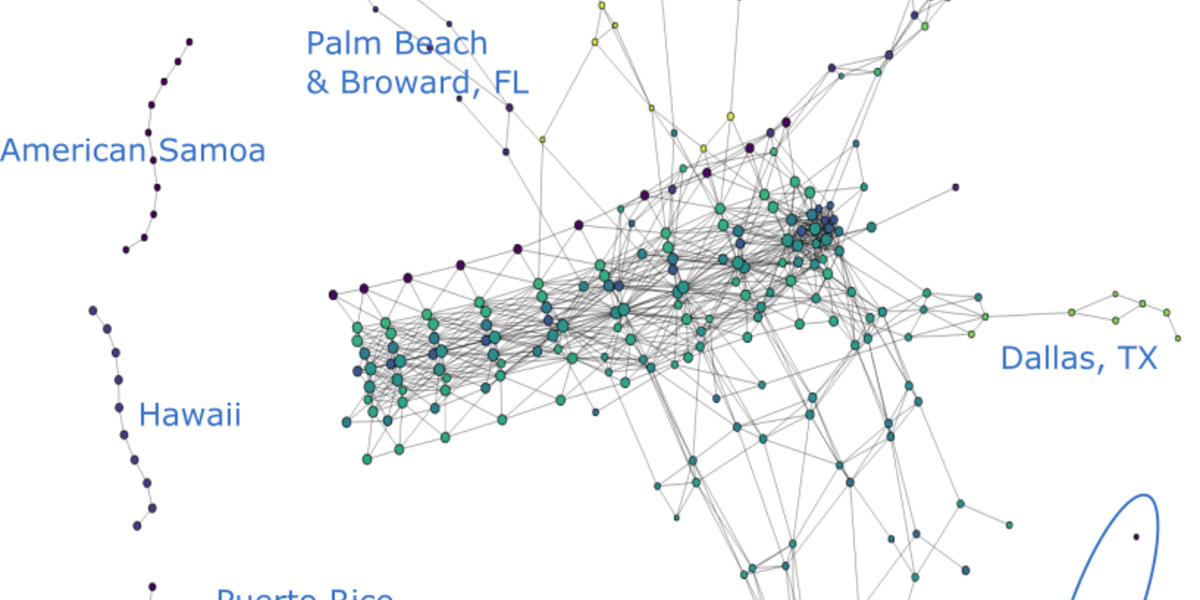
IMD research uses topological data analysis to understand the spread of COVID-19
Topological data analysis regards a data cloud as a topological space and tries to extract information about the data using this geometric point of view. One of IMD’s current projects, conducted by Yiran Chen, seeks to produce better and more informative visualizations of the U.S. COVID-19 time series data using Mapper graphs. In comparison with traditional methods, this visualization makes it very easy to observe and compare the gradual spread of COVID-19 across time and space. We hope that this unique way of visualizing COVID-19 can capture various nuances and convey its spread in the U.S. in a novel way. This unique way of visualizing COVID-19 captures various nuances and conveys its spread in the U.S. in a novel way. You can read more about it in this paper:


