
SCHEDULE
9:45–10:00 Welcome remarks
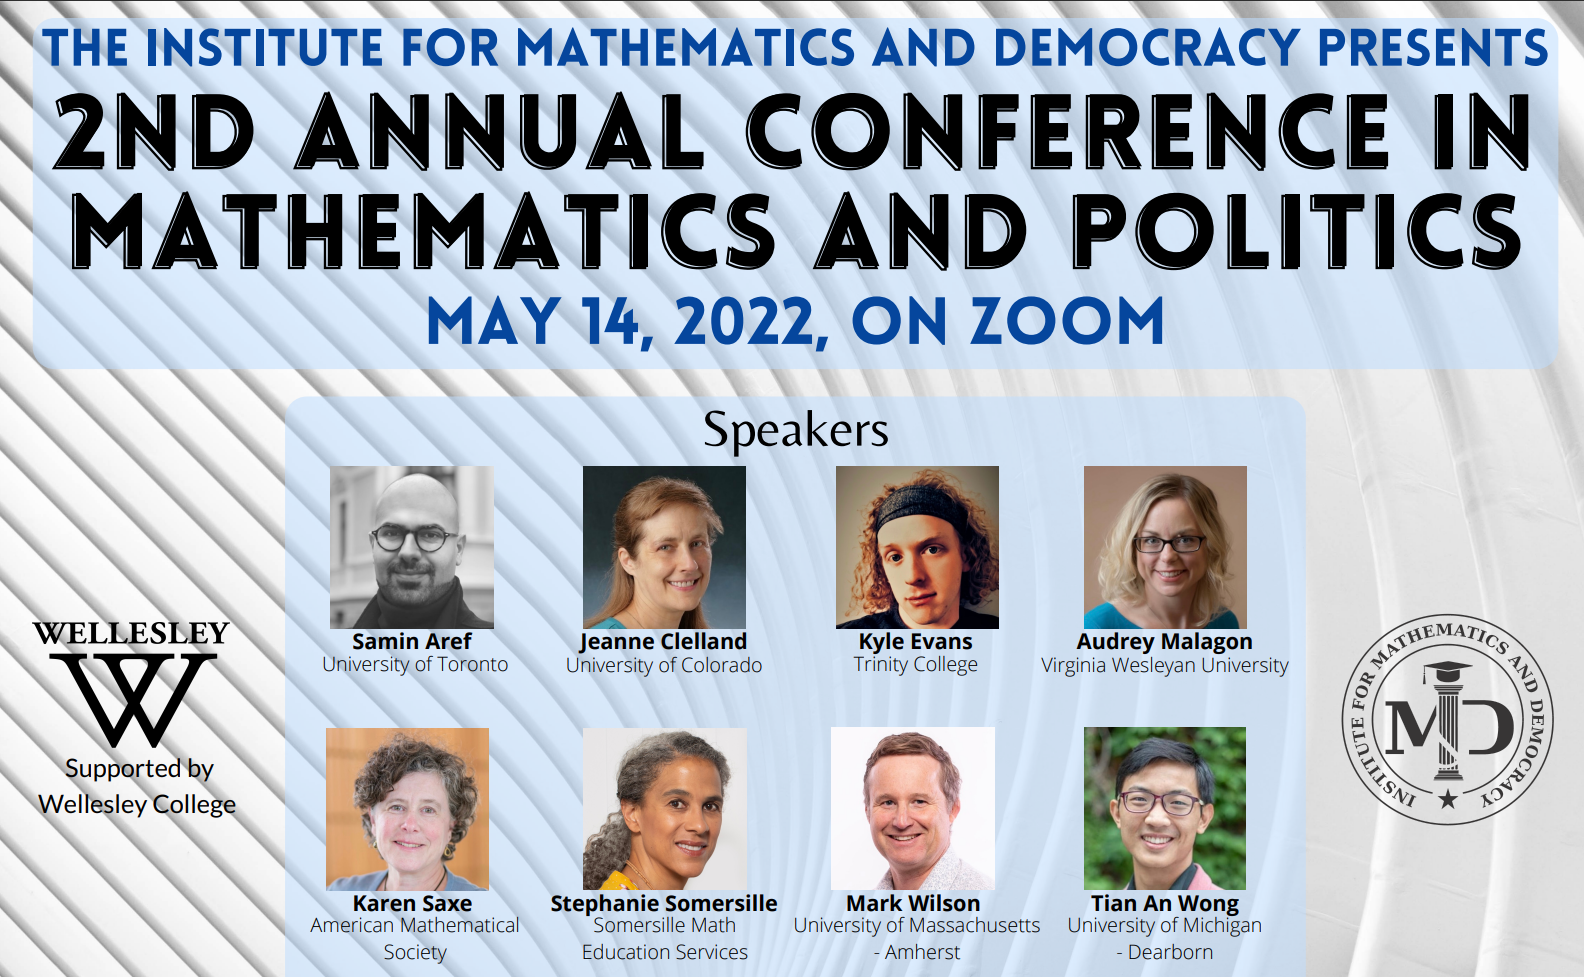
10:00-10:30 Kyle Evans, Trinity College
Teaching mathematics with a political and/or social justice context isn’t just about the content – it requires proper alignment with pedagogy and particularly with assessment. We are asking students to use math to evaluate fairness in the world, but are we evaluating them fairly? In this talk, I will discuss my “Mathematics and Redistricting” course that aims to empower students through authentic uses of math, civic engagement, and ownership of their own learning through self-reflection and assessment. In addition, I will share projects associated with redistricting in Connecticut.
10:30-11:00 Samin Aref, University of Toronto
A signed network is balanced if and only if its set of nodes can be partitioned into 2 clusters such that positive edges are within the clusters and negative edges are between the clusters. According to generalized balance theory, a signed network is k-balanced (clusterable) if and only if its set of nodes can be partitioned into k clusters (k-partitioned) such that positive edges are within the clusters and negative edges are between the clusters.
11:00-11:30 Tian An Wong, University of Michigan - Dearborn
In the summer of 2020, a large subset of the mathematical community agreed to boycott collaboration with the police. But how have mathematicians collaborated with the police? In this talk, I will present an selective overview of predictive policing and predicting police, from mathematical points of view. Time permitting, I will also raise the difficult question of what mathematics can do, if at all, to critique rather than collaborate with the police.
11:30-12:00 Karen Saxe, American Mathematical Society
As Director of the Office of Government Relations for the American Mathematical Society, I work to connect the math community to policy-makers in Washington, DC. We advocate for support for mathematics research and education, educate congressional staff about topics they are working on and that mathematics informs, and work to advance policies that will support the mathematics community. I will describe this work, and ways in which you can get involved.
12:00-1:30 Break
1:30-2:00 Stephanie Somersille, Somersille Math Education Services
We’ll give a brief introduction to redistricting and gerrymandering and will outline some currently popular metrics. Then we’ll introduce the new GEO metric which analyzes maps based on both the geography of the area and election outcome data which indicate voters’ party preference. We’ll see efficient analyses of the new districting maps created in 2021 and 2022.
2:00-2:30 Mark Wilson, University of Massachusetts – Amherst
Consider an election of a given type (say a legislative or presidential election) involving some set of districts for which we have data at two distinct points in time, time 1 and time 2. If there are only two political parties, A and B, we may think of the overall difference in the mean party vote share of party A between the two elections as the aggregate inter-election swing between the two parties. If we know this mean inter-election swing, a fundamental question is: “How do we expect the aggregate swing to be distributed across the districts or states (or smaller units such as counties) as a function of previous vote share (and perhaps, other factors)?’’ This has applications to election forecasting and the study of gerrymandering. Historically there have been two main answers to that question: uniform swing and proportional swing. We study them axiomatically and show that neither is satisfactory. We find a method with better axiomatic justification and show it works well on real data.
2:30-3:00 Jeanne Clelland, University of Colorado
What is gerrymandering and how does it work? How can we tell whether a district plan is “fair” – and what does “fair” even really mean? It turns out that this is a more complicated question to answer than you might think!
One way to understand what gerrymandering looks like is to try to understand what “NOT gerrymandering” looks like – i.e., what kinds of outcomes might one reasonably expect for plans drawn without any partisan bias? This leads to the idea of “ensemble analysis”: Have a computer randomly generate a large collection of legally valid district plans without using any partisan information, and then evaluate partisan outcomes for each plan in the ensemble in order to create a range of “reasonable” outcomes. This creates a baseline to compare proposed plans to, along with a presumption that any proposed plan that looks like an “extreme outlier” compared to the ensemble is unlikely to have been drawn without partisan bias.
I’ll describe an example of how this idea has been applied in litigation regarding gerrymandered plans in North Carolina, and also how my research group used it to evaluate proposed plans for the Colorado Independent Legislative Redistricting Commission.
3:00-3:30 Audrey Malagon, Virginia Wesleyan University
Our democracy relies on fair elections in which every voter can have confidence their ballot was counted as cast. Machine tabulations are necessary for efficiency, but we also need quality control measures that spot-check the paper ballots to ensure the machine counts are accurate. Deciding how many ballots to check – and what the results of that spot check can tell you about the accuracy of the election outcome – relies on statistics. Mathematicians, statisticians, political scientists, lawyers, advocates and others all work together to design and implement post-election statistical audits. In this talk, I’ll give an overview of some of the methods used in the past presidential elections and discuss what the future holds for mathematics and elections.